Researching Node Exporter on macOS workstations for homelab monitoring

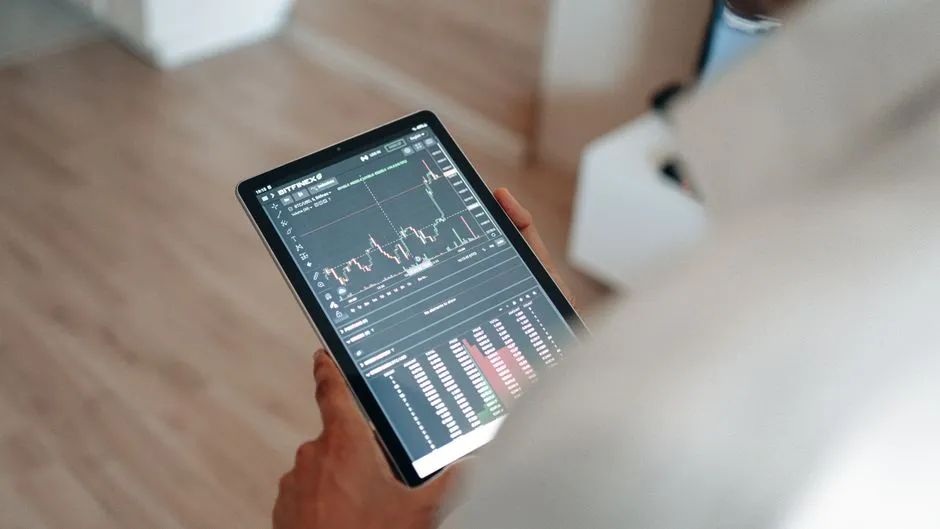
I already run Prometheus and Grafana for the homelab, with iperf3 results folded in through the Node Exporter textfile pattern on servers (network performance testing). The obvious next question was whether my macOS workstations should join the same scrape targets so client-side numbers lived next to everything else.
This post is the research summary, not a deployment guide. I looked at Node Exporter on macOS, compared a few alternatives, thought about security, and decided the value did not justify the cost. The related lab ticket is closed for the same reason. If you are weighing workstation monitoring in a homelab, the tradeoffs below are the ones that mattered to me.
The problem I was trying to solve
Homelab monitoring is full of machines that exist to be watched. Routers, hypervisors, containers, and test endpoints are stable, always-on, and worth a scrape job. Laptops and desktops are different. They sleep, they change networks, and they carry data I care about more than whether /proc-style stats look pretty in Grafana.
The concrete hook was LAN testing. I wanted a clean story for “what did the iperf3 client see” without treating my daily driver like another Proxmox host. If Node Exporter could expose the same textfile metrics I use on servers, I could graph workstation-side throughput in one place.
That sounds small until you add maintenance, security, and the fact that macOS is not Linux. I treated it like a real project, not a one-line brew install.
Is workstation monitoring worth it in a homelab?
Sometimes yes. If you are debugging Wi‑Fi drivers, thermal throttling, or “why is this build slow,” host metrics help. If you are proving SLA-style uptime for a service, you usually monitor the service, not the gamer PC.
For my setup, the honest use cases boiled down to troubleshooting, curiosity, and a handful of performance experiments. None of that required 24/7 collection on every Mac I own. Ephemeral checks and local tools already answer most questions. Persistent scraping only pays off when the dashboards change how you act, not when they duplicate Activity Monitor with extra steps.
That framing kept the bar high. A monitoring endpoint on a laptop is not “free” just because Prometheus already exists.
What Node Exporter looks like on macOS
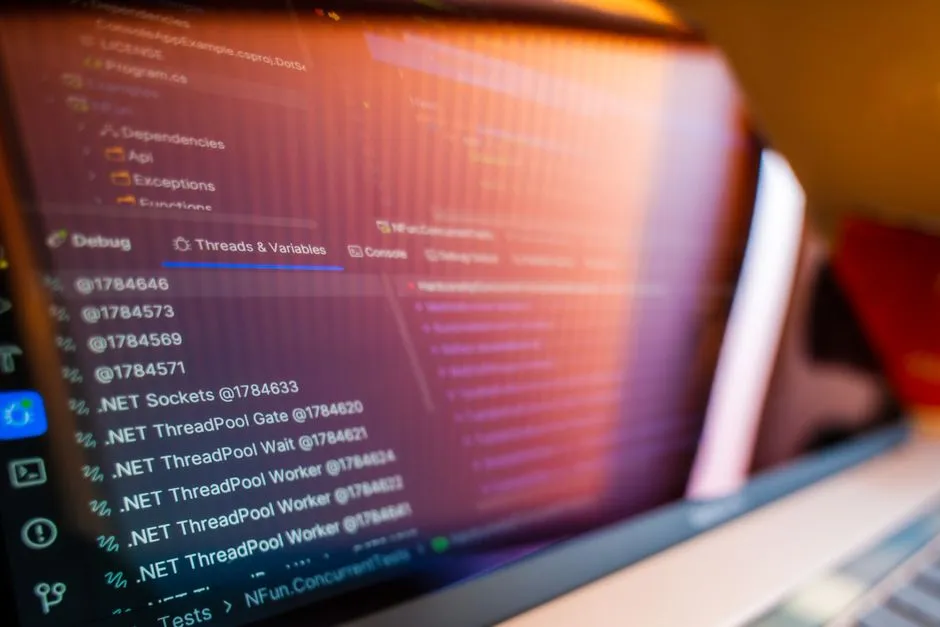
Upstream ships Darwin builds and documents macOS-oriented collectors alongside the broader matrix. You can run it on macOS, and you get real metrics where a collector exists for Darwin. Many collectors are Linux-only or assume sysfs-style paths, so a dashboard or playbook written for servers will not always transfer.
Homelab posts aimed at rack servers still tend to assume a full Linux-shaped metric set. On Apple Silicon I see the same class of mismatch: some series look familiar, others do not line up one-to-one with what you get on Proxmox or Raspberry Pi hosts.
For my goal (textfile metrics from scheduled iperf3 runs), the exporter could probably do the job technically. The harder question was whether I wanted a long-lived metrics agent on machines that leave the house.
Alternatives I compared
I did not try to benchmark every tool on the internet. I focused on options that show up in homelab threads and that map to either Prometheus or a parallel stack I already tolerate.
Mactop is the kind of tool macOS power users reach for when they want native Apple Silicon visibility in the terminal. It is strong at live CPU, GPU, and power storylines without pretending to be a Linux /proc shim. It is not a drop-in replacement for a Prometheus scrape target, but it is a good reminder that “macOS-native” often beats “force the Linux exporter mental model.”
Node Exporter on Darwin stays the default if you insist on Prometheus labels and the same scrape discipline everywhere. Smaller or experimental exporters sometimes fill single gaps people hit on macOS (filesystem visibility is a recurring theme in community notes). I grouped those under “targeted Darwin exporters” in my notes rather than a single product name. They are useful when one missing series blocks a panel; they do not remove the operational overhead of running an exporter on a laptop.
Netdata is a different philosophy: agent-heavy, UI-forward, strong out-of-the-box charts. Some homelabs standardize on it end to end. Mine does not. Adding another full stack on the workstation side just to feed one chart was not appealing.
Telegraf is flexible input-wise and plays well with multiple backends. It is attractive when you want one agent to fan out metrics or logs. It still lands in the same bucket for me: more moving parts on a host I do not want to treat like a server.
None of these tools “failed.” They just solve different problems. The pattern I kept seeing was that macOS rewards purpose-built observability, while generic machine exporters shine on the Linux servers that stay in the rack.
Security and practicality
A Prometheus scrape endpoint on a workstation is a small network service. Even bound to localhost behind an SSH tunnel or VPN, you are still maintaining identity, updates, and mental overhead on a device that moves.
My servers live on controlled VLANs with predictable firewall posture. Laptops roam. Sleeping Macs miss scrapes, which is fine for metrics but noisy if you alert like you would for a router. I did not want on-call style escalation applied to my docked MacBook because the lid closed.
That does not mean workstation scraping is wrong for everyone. It means my threat and ergonomics model did not line up with “always-on exporter on the client.”
The iperf3 use case and the cancellation
The clearest win would have been feeding iperf3 client results through the same textfile pipeline I use on servers. In theory that ties graphs together. In practice I already have server-side and controller-side views that tell me whether the path is healthy. Client-side numbers are nice for deep dives, not daily operations.
Once I wrote that down, the project stopped looking like infrastructure and started looking like a science experiment. I cancelled the work item. Research notes stay in the lab tracker for the next time I get tempted.
Alternative approaches that kept value without the deployment
If the goal is troubleshooting, ad hoc runs beat permanent agents. iperf3 from the terminal, local flame graphs when CPU is weird, and wireless diagnostics when the problem is actually Wi‑Fi. If the goal is trend data, keep the exporters on fixed test hosts and treat clients as variables you change between runs.
Another pattern that works in homelabs is a dedicated small form factor test machine on the same switch as the rest of the rack. It behaves like infrastructure even if it is not a rackmount box. That gives you consistent scrapes without putting Prometheus integration on your primary laptop.
Reflection
I like finishing projects. I also like closing tickets when the numbers say “stop.” This one was a research win and an implementation no-show. Node Exporter on macOS is real, the ecosystem around Prometheus on Darwin keeps maturing, and tools like Mactop are a better fit for how macOS actually exposes performance than pretending every host is a Linux server.
The lesson I am carrying forward is narrower than “exporters bad.” It is that homelab monitoring pays off when signals change maintenance behavior. Workstation scraping did not clear that bar for me, especially once LAN testing stayed anchored on servers and the iperf3 story did not need another always-on agent.
If your bar is different (for example you are chasing thermals on a Mac mini that only ever lives on the management VLAN), the same research probably lands elsewhere. Start from the behavior you want to change, then pick the smallest tool that reaches it. Sometimes that tool is not Prometheus at all.
Related reading
Monitoring UniFi Devices with Prometheus and Grafana
How I wired UniFi Poller into the homelab monitoring stack, which Grafana dashboards expect which metrics, and what broke before the exporter started scraping cleanly.

Prometheus and Grafana: Why Your Homelab Needs Monitoring
What Prometheus and Grafana are, why they're essential for homelab monitoring, and how they help you understand what's actually happening in your infrastructure.
Debugging 'No data' panels on a NUT UPS Grafana dashboard
When Grafana shows 'No data' on a NUT monitoring dashboard, the problem is not always your exporter or Prometheus. Sometimes the UPS hardware just does not report those metrics.
Ready to Transform Your Career?
Let's work together to unlock your potential and achieve your professional goals.